Journal of Applied Meteorological Science (JAMS) started its first publication in 1986 as a comprehensive magazine in atmospheric sciences. Over the past 35 years, the Journal has been focusing on introducing the applications of new theories and techniques in the braches as well as research results from all areas, with focus on heated and socioeconomic-related scientific problems. The Journal consists of articles, short contributions, reviews, forums, operational systems, specific bulletins and comments on meteorological publications. The Journal aims at the close combination of atmospheric theories with practice in an effort to advance the meteorological cause with our colleagues in China. The Journal is indexed in Meteorological & Geoastrophysical Abstracts (MGA) of Earth, Atmospheric & Aquatic Science Database.
keep_len="250">As the climate warms, the threat of high temperature to China's maize production is increasing. Starting from the concept and classification of high temperature heat damage, the research progress is systematically summarized, expounding the hazard mechanism, meteorological causes, disaster causative indicators, spatial and temporal distribution and defense countermeasure of high temperature heat damage of maize, and the future research trend is also discussed. The high temperature heat damage of maize in China has a long duration, and its impacts can be divided into four categories:Delay, obstacle, poor growth and mixed. High temperature reduces the photosynthetic rate of maize, weakens pollen activity, inhibits the scattering of powder, shortens the filling time, and causes the yield and quality of maize to decrease. The high temperature and heat damage weather in maize growing areas is mainly caused by abnormal circulation and affected by the degree of atmospheric dryness. The meteorological causes, main types and occurrence periods of high temperature and heat damage are different in each dominant maize region. The disaster indicators include physiological and biochemical indicators and meteorological indicators, but there is no clear and unified standard for distinguishing high-temperature heat damage in maize at present. In the past 10 years, the intensity and frequency of heat damage of maize have increased. High temperature and heat damage of spring maize mostly occurs in flowering and pollination period, and the risk is higher in northeast Liaoning and southwest of Northeast China. High temperature heat damage of summer maize is more likely to occur after the jointing period, and is more frequent in southeastern Hebei Province, most of Henan Province and western Shandong Province. There are two methods to prevent the high-temperature heat damage of maize. The research on monitoring and early warning of high-temperature heat damage is still in its infancy, and the adverse effects of high-temperature heat damage on maize can be reduced by selecting appropriate field cultivation and management measures. The future research should focus on establishing a comprehensive dynamic maize high temperature heat damage index system, strengthening the simulation and risk assessment and further developing a refined monitoring and early warning service system. As the climate warms, the threat of high temperature to China's maize production is increasing. Starting from the concept and classification of high temperature heat damage, the research progress is systematically summarized, expounding the hazard mechanism, meteorological causes, disaster causative indicators, spatial and temporal distribution and defense countermeasure of high temperature heat damage of maize, and the future research trend is also discussed. The high temperature heat damage of maize in China has a long duration, and its impacts can be divided into four categories:Delay, obstacle, poor growth and mixed. High temperature reduces the photosynthetic rate of maize, weakens pollen activity, inhibits the scattering of powder, shortens the filling time, and causes the yield and quality of maize to decrease. The high temperature and heat damage weather in maize growing areas is mainly caused by abnormal circulation and affected by the degree of atmospheric dryness. The meteorological causes, main types and occurrence periods of high temperature and heat damage are different in each dominant maize region. The disaster indicators include physiological and biochemical indicators and meteorological indicators, but there is no clear and unified standard for distinguishing high-temperature heat damage in maize at present. In the past 10 years, the intensity and frequency of heat damage of maize have increased. High temperature and heat damage of spring maize mostly occurs in flowering and pollination period, and the risk is higher in northeast Liaoning and southwest of Northeast China. High temperature heat damage of summer maize is more likely to occur after the jointing period, and is more frequent in southeastern Hebei Province, most of Henan Province and western Shandong Province. There are two methods to prevent the high-temperature heat damage of maize. The research on monitoring and early warning of high-temperature heat damage is still in its infancy, and the adverse effects of high-temperature heat damage on maize can be reduced by selecting appropriate field cultivation and management measures. The future research should focus on establishing a comprehensive dynamic maize high temperature heat damage index system, strengthening the simulation and risk assessment and further developing a refined monitoring and early warning service system.
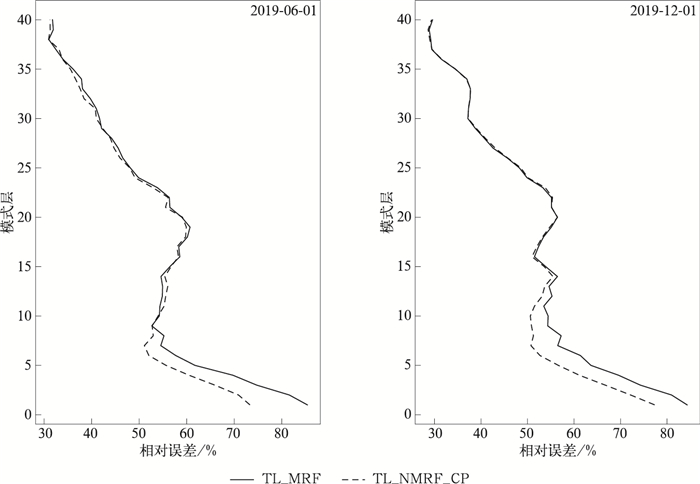
keep_len="250">By continuously developing and optimizing the linearized physical process of the tangent linear model and keeping it consistent with the nonlinear model, the analysis and forecasting performance of four-dimensional variational data assimilation (4DVar) of China Meteorological Administration Global Forecast System (CMA-GFS) can be effectively improved. Currently, the planetary boundary layer (PBL) parameterization scheme adopted by CMA-GFS model is based on Charney-Phillips (C-P) grid, while the linearization PBL parameterization scheme used in CMA-GFS 4DVar is on the basis of Lorenz grid. The zigzag noise of the temperature and moisture in the boundary layer is removed and the correspondent profiles appear to be smooth with C-P PBL parameterization scheme, and the forecast errors of CMA-GFS model are effectively reduced. To improve the analysis and prediction effects of 4DVar on the boundary layer, a new linearized PBL parameterization scheme based on the C-P grid (TL_NMRF_CP) is developed. By making more refined regularization constraints on the disturbances of the surface heat flux, the surface water vapor flux, Richardson coefficient of the free atmosphere, the heat and momentum exchange coefficient of the boundary layer, the influence of the linearization process on the accuracy of the tangent linear approximation is reduced while ensuring stable operation of the tangent linear and adjoint models. Two tests are designed, one is TL_MRF test based on the original TL_MRF scheme and the other is TL_NMRF_CP test based on the TL_NMRF_CP scheme. The tangent linear approximation tests show that, compared with the original scheme, the TL_NMRF_CP scheme can improve the tangent linear model forecast accuracy on the boundary layer, reduce the relative error of the potential temperature of the boundary layer by up to 10%, reduce the relative error of the specific humidity by 5% at the most, and reduce the relative error of zonal wind by up to 12%. In the minimization process of CMA-GFS 4DVar, the TL_NMRF_CP scheme can reduce the relative difference of the cost functions caused by different resolutions between inner and outer loops of the 4DVar system, and improve the convergence efficiency of 4DVar. The batch cycle assimilation forecast experiments of CMA-GFS 4DVar further verify that the TL_NMRF_CP scheme can provide better analysis and prediction results. The TL_NMRF_CP scheme has also been applied to CMA-GFS 4DVar operation system. By continuously developing and optimizing the linearized physical process of the tangent linear model and keeping it consistent with the nonlinear model, the analysis and forecasting performance of four-dimensional variational data assimilation (4DVar) of China Meteorological Administration Global Forecast System (CMA-GFS) can be effectively improved. Currently, the planetary boundary layer (PBL) parameterization scheme adopted by CMA-GFS model is based on Charney-Phillips (C-P) grid, while the linearization PBL parameterization scheme used in CMA-GFS 4DVar is on the basis of Lorenz grid. The zigzag noise of the temperature and moisture in the boundary layer is removed and the correspondent profiles appear to be smooth with C-P PBL parameterization scheme, and the forecast errors of CMA-GFS model are effectively reduced. To improve the analysis and prediction effects of 4DVar on the boundary layer, a new linearized PBL parameterization scheme based on the C-P grid (TL_NMRF_CP) is developed. By making more refined regularization constraints on the disturbances of the surface heat flux, the surface water vapor flux, Richardson coefficient of the free atmosphere, the heat and momentum exchange coefficient of the boundary layer, the influence of the linearization process on the accuracy of the tangent linear approximation is reduced while ensuring stable operation of the tangent linear and adjoint models. Two tests are designed, one is TL_MRF test based on the original TL_MRF scheme and the other is TL_NMRF_CP test based on the TL_NMRF_CP scheme. The tangent linear approximation tests show that, compared with the original scheme, the TL_NMRF_CP scheme can improve the tangent linear model forecast accuracy on the boundary layer, reduce the relative error of the potential temperature of the boundary layer by up to 10%, reduce the relative error of the specific humidity by 5% at the most, and reduce the relative error of zonal wind by up to 12%. In the minimization process of CMA-GFS 4DVar, the TL_NMRF_CP scheme can reduce the relative difference of the cost functions caused by different resolutions between inner and outer loops of the 4DVar system, and improve the convergence efficiency of 4DVar. The batch cycle assimilation forecast experiments of CMA-GFS 4DVar further verify that the TL_NMRF_CP scheme can provide better analysis and prediction results. The TL_NMRF_CP scheme has also been applied to CMA-GFS 4DVar operation system.
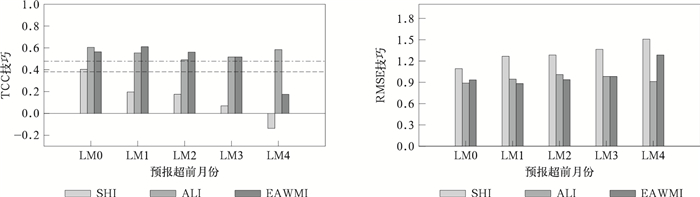
keep_len="250">Accurate prediction of East Asian winter climate has become an important topic in climate research. Coupled ocean-atmosphere dynamical model prediction systems have made great progress. It can offer overall outstanding performance, and become the major tool of dynamical climate prediction. The seasonal prediction performance of BCC_CSM1.1m model has been systematically evaluated. It's found that although the model can predict temperature, precipitation, snow cover, and Asian monsoon to some extent, there are still great challenges in the prediction of East Asian winter climate. It is important to analyze the possible causes of model biases and reveal the source of its predictability. Based on the hindcasts of BCC_CSM1.1m, time correlation coefficient and root mean square error are analyzed to evaluate the prediction skills of 3 typical East Asian winter circulation systems, including Siberian high (SH), Aleutian low (AL) and East Asian winter monsoon (EAWM). Then the predictability sources are also examined through time series analysis and pattern correlation coefficient. The results show that the prediction of sea level pressure in tropical region is better than that in the middle and high latitude region. Due to the influence of El Niño and Southern Oscillation (ENSO) and its remote teleconnection, the sea level pressure prediction over the ocean is better than that over the continent, which results in better prediction skills of AL and EAWM compared to SH. Further analysis shows that the elimination of super El Niño years leads to lower prediction skills of AL and EAWM. The correlation between sea level pressure in Eurasia and ENSO is less than that in tropical and north Pacific regions, indicating that ENSO is an important source of predictability of AL and EAWM. It is also found that soil temperature at 0-10 cm in Siberia is an important factor affecting the simultaneous and later SH, which suggests that the predictability of the SH may come from the shallow soil temperature. After removing super El Niño years, the prediction skill of SH is altered greatly, which reflects the modulation of ENSO on SH prediction. The model can overestimate the linear relationship between SH and ENSO, and lead to a poor SH prediction skill. Moreover, the prediction of EAWM depends on the accurate prediction of SH and AL, and its prediction skill is restricted by the poor SH prediction skills to some extent. Accurate prediction of East Asian winter climate has become an important topic in climate research. Coupled ocean-atmosphere dynamical model prediction systems have made great progress. It can offer overall outstanding performance, and become the major tool of dynamical climate prediction. The seasonal prediction performance of BCC_CSM1.1m model has been systematically evaluated. It's found that although the model can predict temperature, precipitation, snow cover, and Asian monsoon to some extent, there are still great challenges in the prediction of East Asian winter climate. It is important to analyze the possible causes of model biases and reveal the source of its predictability. Based on the hindcasts of BCC_CSM1.1m, time correlation coefficient and root mean square error are analyzed to evaluate the prediction skills of 3 typical East Asian winter circulation systems, including Siberian high (SH), Aleutian low (AL) and East Asian winter monsoon (EAWM). Then the predictability sources are also examined through time series analysis and pattern correlation coefficient. The results show that the prediction of sea level pressure in tropical region is better than that in the middle and high latitude region. Due to the influence of El Niño and Southern Oscillation (ENSO) and its remote teleconnection, the sea level pressure prediction over the ocean is better than that over the continent, which results in better prediction skills of AL and EAWM compared to SH. Further analysis shows that the elimination of super El Niño years leads to lower prediction skills of AL and EAWM. The correlation between sea level pressure in Eurasia and ENSO is less than that in tropical and north Pacific regions, indicating that ENSO is an important source of predictability of AL and EAWM. It is also found that soil temperature at 0-10 cm in Siberia is an important factor affecting the simultaneous and later SH, which suggests that the predictability of the SH may come from the shallow soil temperature. After removing super El Niño years, the prediction skill of SH is altered greatly, which reflects the modulation of ENSO on SH prediction. The model can overestimate the linear relationship between SH and ENSO, and lead to a poor SH prediction skill. Moreover, the prediction of EAWM depends on the accurate prediction of SH and AL, and its prediction skill is restricted by the poor SH prediction skills to some extent.
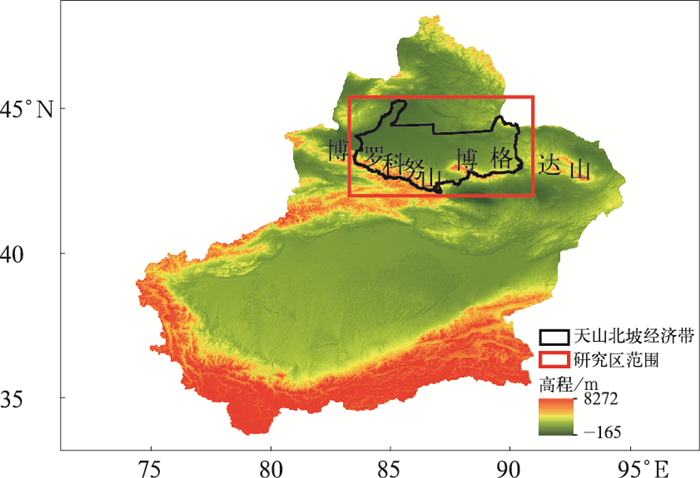
keep_len="250">The economic belt of the northern slope of Tianshan Mountains (NSTM) has important social, economic and ecological effects in Xinjiang. Thus, it is critical to improve the prediction ability of sub-seasonal to seasonal rainfall in this region. Focusing on the large terrain of Tianshan Mountains, the global high-resolution climate prediction operational system version 3 developed by China Meteorological Administration (CMA-CPSv3) is applied. The sub-seasonal to seasonal rainfall over the NSTM is predicted by using the control run, the traditional ensemble mean, and the improved optimal deterministic ensemble forecast using a probabilistic threshold (DEFPT), respectively. The DEFPT method is not intended to predict the probability of rainfall, but to forecast the occurrence (yes or no) of rainfall event in any model grid box by judging whether it exceeds a certain probabilistic threshold, and the spatial-temporal distribution characteristic is analyzed. All the predictions are evaluated by the frequency bias, equitable threat score (ETS), Hanssen and Kuipers score (HK) and anomaly correlation coefficient (ACC). The evaluation results show that the improved DEFPT method can improve the sub-seasonal to seasonal predictions of the 1-5 mm rainfall locations and persistence over the NSTM and is superior to the traditional ensemble mean and the control run. These results also indicate that it is necessary to combine numerical model prediction with proper objective ensemble prediction method, especially in regions with large terrain background and significant climatology difference. Based upon the analyses of three rainfall events (during 29 July-2 August of 2016, 7-11 June of 2017, and 8-12 July of 2020, respectively), the DEFPT method performs better in western and southern NSTM from the perspectives of rainfall locations, anomalies and persistence. However, the prediction ability is relatively low in the eastern and northern parts of NSTM, which is possibly related to the low skill of humidity prediction from each ensemble member in corresponding regions. In addition, this method can also be used in other regions by tuning the related empirical coefficients in the formula to limit forecasting biases. The economic belt of the northern slope of Tianshan Mountains (NSTM) has important social, economic and ecological effects in Xinjiang. Thus, it is critical to improve the prediction ability of sub-seasonal to seasonal rainfall in this region. Focusing on the large terrain of Tianshan Mountains, the global high-resolution climate prediction operational system version 3 developed by China Meteorological Administration (CMA-CPSv3) is applied. The sub-seasonal to seasonal rainfall over the NSTM is predicted by using the control run, the traditional ensemble mean, and the improved optimal deterministic ensemble forecast using a probabilistic threshold (DEFPT), respectively. The DEFPT method is not intended to predict the probability of rainfall, but to forecast the occurrence (yes or no) of rainfall event in any model grid box by judging whether it exceeds a certain probabilistic threshold, and the spatial-temporal distribution characteristic is analyzed. All the predictions are evaluated by the frequency bias, equitable threat score (ETS), Hanssen and Kuipers score (HK) and anomaly correlation coefficient (ACC). The evaluation results show that the improved DEFPT method can improve the sub-seasonal to seasonal predictions of the 1-5 mm rainfall locations and persistence over the NSTM and is superior to the traditional ensemble mean and the control run. These results also indicate that it is necessary to combine numerical model prediction with proper objective ensemble prediction method, especially in regions with large terrain background and significant climatology difference. Based upon the analyses of three rainfall events (during 29 July-2 August of 2016, 7-11 June of 2017, and 8-12 July of 2020, respectively), the DEFPT method performs better in western and southern NSTM from the perspectives of rainfall locations, anomalies and persistence. However, the prediction ability is relatively low in the eastern and northern parts of NSTM, which is possibly related to the low skill of humidity prediction from each ensemble member in corresponding regions. In addition, this method can also be used in other regions by tuning the related empirical coefficients in the formula to limit forecasting biases.
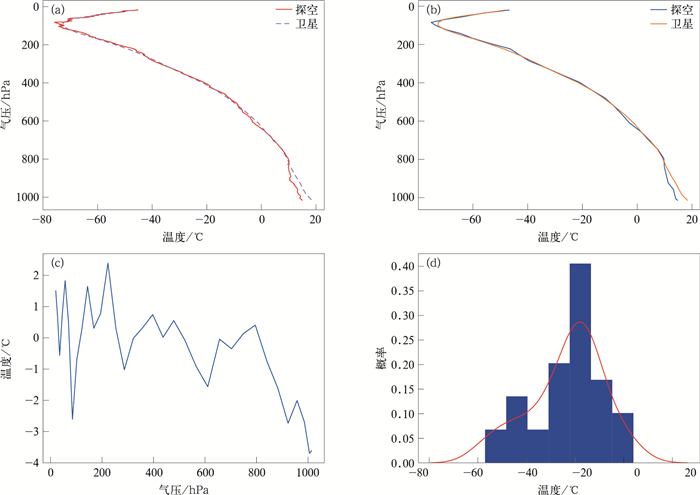
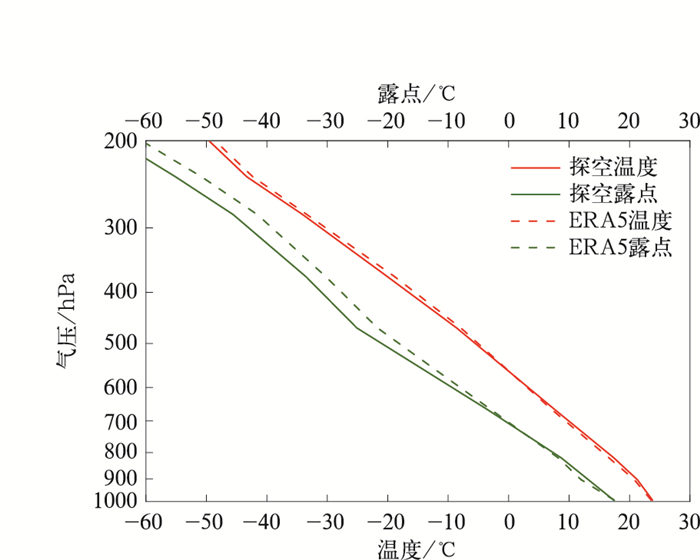
keep_len="250">The horizontal drift round-trip sounding observation is a new sounding technology developed by China Meteorological Administration. By releasing one sounding balloon with this technology, three sections of observations can be obtained, including two sections of vertical tropospheric sounding(ascending and descending) with an interval of about 6 hours and a 4-hour horizontal sounding within the stratosphere. This technology effectively makes up for the insufficiency of conventional soundings, improving the time and space resolution of radiosonde data at a lower cost. The detection system adopts Beidou radiosonde, which significantly improves the accuracy of sounding and wind measurements. In addition, the drift section of horizontal drift round-trip sounding observation fills the gap of the stratospheric temperature detection technology in China. Therefore, horizontal drift round-trip sounding data can be used to verify the temperature profile and stratosphere temperature data of meteorological satellite.Fengyun series meteorological satellites are widely used in China, supporting the meteorological forecast in the Eastern Hemisphere. Among Fengyun satellites in use, FY-3D has the longest years of service. To test the accuracy of FY-3D satellite temperature products, an algorithm is designed according to the characteristics of the horizontal drift round-trip sounding data and satellite data, and the temporal and spatial thresholds are calculated. Based on this algorithm, FY-3D satellite retrieved atmospheric temperature data are verified using the horizontal drift round-trip sounding data in the middle and lower reaches of the Yangtze from March to September in 2021. It can be concluded from the inspection results that the temperature data of FY-3D satellite has a high accuracy, with an average absolute deviation of about 1.34℃ from the data of ascending section and 1.9℃ from the data of descending section. Above 100 hPa and below 850 hPa, the temperature errors of satellite data are 0.59℃ and 0.33℃ larger, respectively. The average absolute deviation of the stratosphere is about 3.92℃, which is slightly larger than the ascending section and descending section. Compared with the sounding profile, the satellite temperature profile has lower vertical resolution and smoother trend, so it cannot show more details of atmospheric vertical variation. The horizontal drift round-trip sounding observation is a new sounding technology developed by China Meteorological Administration. By releasing one sounding balloon with this technology, three sections of observations can be obtained, including two sections of vertical tropospheric sounding(ascending and descending) with an interval of about 6 hours and a 4-hour horizontal sounding within the stratosphere. This technology effectively makes up for the insufficiency of conventional soundings, improving the time and space resolution of radiosonde data at a lower cost. The detection system adopts Beidou radiosonde, which significantly improves the accuracy of sounding and wind measurements. In addition, the drift section of horizontal drift round-trip sounding observation fills the gap of the stratospheric temperature detection technology in China. Therefore, horizontal drift round-trip sounding data can be used to verify the temperature profile and stratosphere temperature data of meteorological satellite.Fengyun series meteorological satellites are widely used in China, supporting the meteorological forecast in the Eastern Hemisphere. Among Fengyun satellites in use, FY-3D has the longest years of service. To test the accuracy of FY-3D satellite temperature products, an algorithm is designed according to the characteristics of the horizontal drift round-trip sounding data and satellite data, and the temporal and spatial thresholds are calculated. Based on this algorithm, FY-3D satellite retrieved atmospheric temperature data are verified using the horizontal drift round-trip sounding data in the middle and lower reaches of the Yangtze from March to September in 2021. It can be concluded from the inspection results that the temperature data of FY-3D satellite has a high accuracy, with an average absolute deviation of about 1.34℃ from the data of ascending section and 1.9℃ from the data of descending section. Above 100 hPa and below 850 hPa, the temperature errors of satellite data are 0.59℃ and 0.33℃ larger, respectively. The average absolute deviation of the stratosphere is about 3.92℃, which is slightly larger than the ascending section and descending section. Compared with the sounding profile, the satellite temperature profile has lower vertical resolution and smoother trend, so it cannot show more details of atmospheric vertical variation.
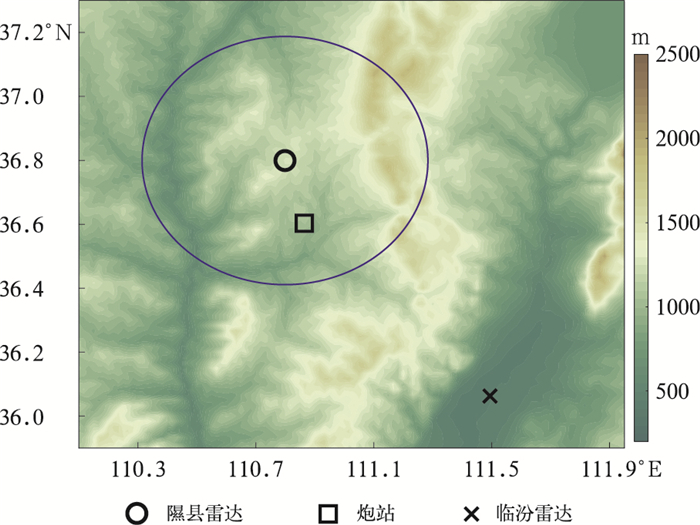
keep_len="250">Phased-array dual polarization weather radar has the capability on high spatial-temporal resolution detection and microphysical analysis, and it is deemed a new approach of strong convection monitoring and research. If applied in hail suppression operation, it is expected to improve the ability of operation command and effect evaluation. Hence, a case study is carried out on a hail suppression operation by anti-aircraft gun in Xi County, Linfen City, Shanxi Province on 28 June 2021. A phased array dual polarization weather radar is used, which outputs a volume scan data every minute consisting of 21 elevation levels. The radial resolution is 30 m, and the elevation resolution is 1.8°. Based on such high spatial-temporal resolution observations, the phenomenon and mechanisms of the severe convective cell before and after operation are analyzed, including the time series of reflectivity top height and the dynamic and microphysics features in the RHI(range height indicator) profiles. The top height of 55 dBZ reflectivity declines rapidly within 1 min after hail suppression operation, steeping down 2 km to below 0℃ height and maintains. After that, the top height of reflectivity has a short recovery due to the effect of cells merging, but then gradually decreases. 1 min after the operation, the vertical structure of high horizontal reflectivity (ZH) is fractured near 0℃ layer. The parameter of radial velocity divergence (RVD) is proposed to diagnose the vertical airflow structure, showing that the convergence areas in the front and rear of the cell weaken or disappear. The differential reflectivity (ZDR) increases near ground, and the specific phase shift (KDP) increases in the middle and low layers. The ZDR column disappears. There is a column of co-polar correlation coefficient (CC) with the value 0.94-0.96 from the near ground level to 0℃ layer. The small area of the supercooled water in the upper part of the cell core disappears. Below 0℃ layer, the mixed columnar distribution of rain and hail, graupel, wet snow and various rain changes to heavy rain in the low-level. Therefore, these short-term and obvious changes can support the theories of hail suppression by explosion. Phased-array dual polarization weather radar has the capability on high spatial-temporal resolution detection and microphysical analysis, and it is deemed a new approach of strong convection monitoring and research. If applied in hail suppression operation, it is expected to improve the ability of operation command and effect evaluation. Hence, a case study is carried out on a hail suppression operation by anti-aircraft gun in Xi County, Linfen City, Shanxi Province on 28 June 2021. A phased array dual polarization weather radar is used, which outputs a volume scan data every minute consisting of 21 elevation levels. The radial resolution is 30 m, and the elevation resolution is 1.8°. Based on such high spatial-temporal resolution observations, the phenomenon and mechanisms of the severe convective cell before and after operation are analyzed, including the time series of reflectivity top height and the dynamic and microphysics features in the RHI(range height indicator) profiles. The top height of 55 dBZ reflectivity declines rapidly within 1 min after hail suppression operation, steeping down 2 km to below 0℃ height and maintains. After that, the top height of reflectivity has a short recovery due to the effect of cells merging, but then gradually decreases. 1 min after the operation, the vertical structure of high horizontal reflectivity (ZH) is fractured near 0℃ layer. The parameter of radial velocity divergence (RVD) is proposed to diagnose the vertical airflow structure, showing that the convergence areas in the front and rear of the cell weaken or disappear. The differential reflectivity (ZDR) increases near ground, and the specific phase shift (KDP) increases in the middle and low layers. The ZDR column disappears. There is a column of co-polar correlation coefficient (CC) with the value 0.94-0.96 from the near ground level to 0℃ layer. The small area of the supercooled water in the upper part of the cell core disappears. Below 0℃ layer, the mixed columnar distribution of rain and hail, graupel, wet snow and various rain changes to heavy rain in the low-level. Therefore, these short-term and obvious changes can support the theories of hail suppression by explosion.
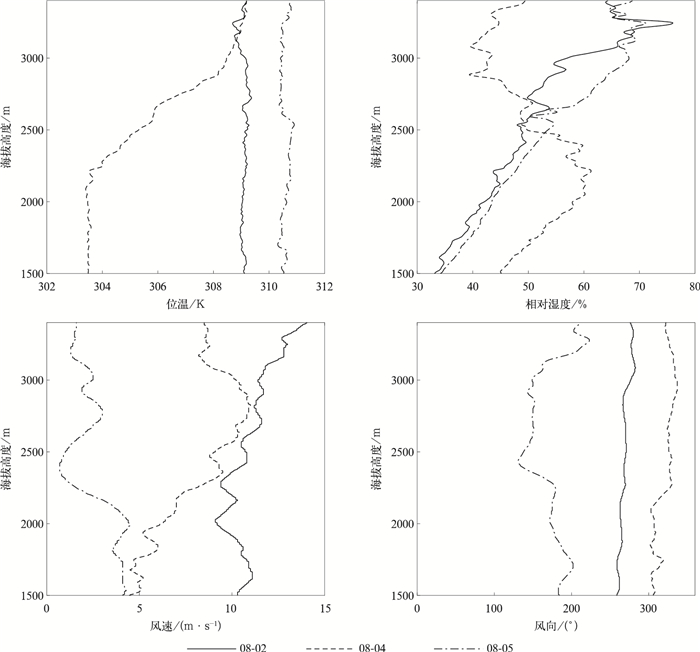
keep_len="250">Satellite navigation-based autonomous drones have become an important platform for atmospheric exploration. In order to overcome the harsh take-off and landing conditions of fixed-wing UAVs and the short flight time of rotorcraft, a new composite wing UAV with rotary and fixed-wing has been developed by Middle Atmosphere and Global Environment Exploration Laboratory of Institute of Atmospheric Physics, Chinese Academy of Sciences. Two field experiments of UAV soundings are carried out in Zhengxiangbaiqi, Inner Mongolia from 28 July to 6 August in 2020 and from 1 August to 6 August in 2021 to examine the performance of sounding sensors onboard the new type of UAV. The instruments used and the experiments conducted in the two phases of the experiment are introduced first, and then the temperature and relative humidity profile data obtained by different sensors onboard the UAV are compared and analyzed. The results show that the temperature bias between the AWS and the GPS radiosonde onboard UAV is about 2.00 to 2.35℃; the systematic deviation can be revised, and the correlation coefficient is 0.98. The deviation of relative humidity is 4.28% and the correlation coefficient is 0.84 in 2020. The Vaisala temperature and humidity probe are onboard the UAV in the experiment of 2021, which are in good agreement with GPS radiosonde, but the AWS is vastly different from both. The flight sounding test shows that the long-endurance composite wing UAV with rotary and fixed-wing can obtain meteorological information in the near-surface atmosphere because of its larger vertical and horizontal range than the conventional rotary-wing UAV. The AWS onboard new composite wing UAV can obtain temperature and humidity profile information of the near-surface atmosphere, but the time lag effect caused by fast descent speed is obvious. Therefore, the sensor with obvious time lag effect is not suitable for the sounding of faster flight speed. The flight attitude change and turn of the UAV in the level flight process have no obvious effects on the measurements of temperature and humidity. Satellite navigation-based autonomous drones have become an important platform for atmospheric exploration. In order to overcome the harsh take-off and landing conditions of fixed-wing UAVs and the short flight time of rotorcraft, a new composite wing UAV with rotary and fixed-wing has been developed by Middle Atmosphere and Global Environment Exploration Laboratory of Institute of Atmospheric Physics, Chinese Academy of Sciences. Two field experiments of UAV soundings are carried out in Zhengxiangbaiqi, Inner Mongolia from 28 July to 6 August in 2020 and from 1 August to 6 August in 2021 to examine the performance of sounding sensors onboard the new type of UAV. The instruments used and the experiments conducted in the two phases of the experiment are introduced first, and then the temperature and relative humidity profile data obtained by different sensors onboard the UAV are compared and analyzed. The results show that the temperature bias between the AWS and the GPS radiosonde onboard UAV is about 2.00 to 2.35℃; the systematic deviation can be revised, and the correlation coefficient is 0.98. The deviation of relative humidity is 4.28% and the correlation coefficient is 0.84 in 2020. The Vaisala temperature and humidity probe are onboard the UAV in the experiment of 2021, which are in good agreement with GPS radiosonde, but the AWS is vastly different from both. The flight sounding test shows that the long-endurance composite wing UAV with rotary and fixed-wing can obtain meteorological information in the near-surface atmosphere because of its larger vertical and horizontal range than the conventional rotary-wing UAV. The AWS onboard new composite wing UAV can obtain temperature and humidity profile information of the near-surface atmosphere, but the time lag effect caused by fast descent speed is obvious. Therefore, the sensor with obvious time lag effect is not suitable for the sounding of faster flight speed. The flight attitude change and turn of the UAV in the level flight process have no obvious effects on the measurements of temperature and humidity.
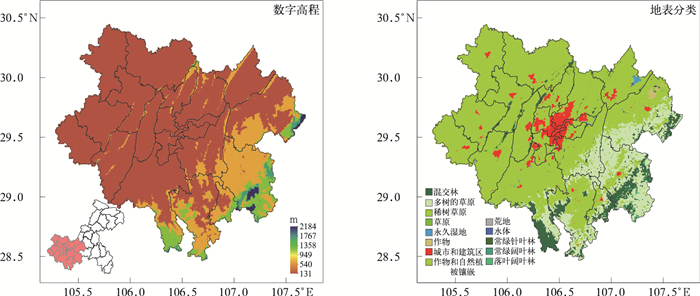
keep_len="250">With global warming and rapid urbanization, urban climate is considered to be one important factor impacting urban ecological environment, and the most obvious feature of urban climate is the surface urban heat island(SUHI). The accurate division of rural reference area is critical in evaluating the intensity of SUHI in mountainous cities by urban-rural dichotomy. Therefore, a comprehensive method is proposed based on multi-source satellite remote sensing data to solve this problem, and the spatiotemporal variation of the SUHI in Chongqing metropolitan circle from 2001 to 2020 are analyzed. The results show that the spatial distribution of rural reference area obtained by the comprehensive buffer method is obviously different from that by the traditional buffer method, and the main cause is the limitation of the elevation difference between urban and rural reference area. There are a large number of "false SUHI" pixels in the SUHI product estimated by the traditional buffer method, which makes the surface urban heat island regions obtained by the traditional buffer method significantly larger than that by the comprehensive buffer method. The spatiotemporal distribution results show that the regions affected by the SUHI are concentrated in the core area of Chongqing, Changshou, Fuling and nearby regions, and the cold island are concentrated in the high-altitude areas in the southeast of Chongqing and some mountains in the core of Chongqing. The interannual variation of the SUHI shows that the proportion of areas above strong SUHI level increases with time from 2001 to 2020, and the SUHI is strong in summer and weak in winter. The proportion of strong SUHI area increased from 0.5% in 2001 to 2.95% in 2020, with an average annual growth rate of 0.12%. The proportion of intense heat island area increased from 0.21% in 2001 to 0.78% in 2019, with an average annual growth rate of 0.03%. The change of SUHI is closely related to urban development, and has a significant positive correlation with the economic driving factors such as the total population of the main city and metropolitan area, urban population, GDP, total energy consumption, urban built-up area and civil vehicle ownership. The correlation coefficients are 0.91, 0.94, 0.95, 0.94, 0.90 and 0.96, respectively, indicating that the driving factors of urban economy play an obvious role in promoting the change of SUHI intensity in the main metropolitan area. With global warming and rapid urbanization, urban climate is considered to be one important factor impacting urban ecological environment, and the most obvious feature of urban climate is the surface urban heat island(SUHI). The accurate division of rural reference area is critical in evaluating the intensity of SUHI in mountainous cities by urban-rural dichotomy. Therefore, a comprehensive method is proposed based on multi-source satellite remote sensing data to solve this problem, and the spatiotemporal variation of the SUHI in Chongqing metropolitan circle from 2001 to 2020 are analyzed. The results show that the spatial distribution of rural reference area obtained by the comprehensive buffer method is obviously different from that by the traditional buffer method, and the main cause is the limitation of the elevation difference between urban and rural reference area. There are a large number of "false SUHI" pixels in the SUHI product estimated by the traditional buffer method, which makes the surface urban heat island regions obtained by the traditional buffer method significantly larger than that by the comprehensive buffer method. The spatiotemporal distribution results show that the regions affected by the SUHI are concentrated in the core area of Chongqing, Changshou, Fuling and nearby regions, and the cold island are concentrated in the high-altitude areas in the southeast of Chongqing and some mountains in the core of Chongqing. The interannual variation of the SUHI shows that the proportion of areas above strong SUHI level increases with time from 2001 to 2020, and the SUHI is strong in summer and weak in winter. The proportion of strong SUHI area increased from 0.5% in 2001 to 2.95% in 2020, with an average annual growth rate of 0.12%. The proportion of intense heat island area increased from 0.21% in 2001 to 0.78% in 2019, with an average annual growth rate of 0.03%. The change of SUHI is closely related to urban development, and has a significant positive correlation with the economic driving factors such as the total population of the main city and metropolitan area, urban population, GDP, total energy consumption, urban built-up area and civil vehicle ownership. The correlation coefficients are 0.91, 0.94, 0.95, 0.94, 0.90 and 0.96, respectively, indicating that the driving factors of urban economy play an obvious role in promoting the change of SUHI intensity in the main metropolitan area.
keep_len="250">Liaoning is one of the active regions for tornadoes in China, and the generation of a considerable number of tornadoes is associated with extratropical cyclones. In order to improve the understanding of environmental background and physical parameter characteristics, 42 extratropical cyclone tornadoes in Liaoning from 1979 to 2020 are statistically analyzed. The study is based on the reanalysis data of ERA5(ECMWF Reanalysis V5), combining with records of China Meteorological Disaster Classic and China Meteorological Disaster Yearbook. Results show that extratropical cyclone tornadoes are mainly distributed in the central and western Liaohe Plain and along the coast of the Bohai Bay. Significant tornadoes(EF2 and above) account for 28.6% of all extratropical cyclone tornadoes.Extratropical cyclone tornadoes occur mostly in the southwest and southeast quadrants of extratropical cyclones, corresponding to the warm area before the cold front. The high-value area of the storm relative helicity and convective available potential energy(CAPE) appear in the southwest-southeast quadrant of the extratropical cyclones, with a belt-like distribution. Extratropical cyclone tornadoes are mainly distributed within 1° of latitude in the northwest of the large-value area of storm relative helicity and the strong gradient area at the top of the large-value area of CAPE. The strong tornado parameter(STP) center is located near the -2° of longitude distance and -5° of latitude distance from the center of tornadic extratropical cyclones, and the maximum value is above 0.7. The large value area of STP corresponds to the high-incidence area of EF2 and above extratropical cyclone tornadoes. The cold front and dry line in the surface are the key trigger of extratropical cyclone tornadoes, and the induced tornadoes are mainly distributed near the warm ridge of temperature field and the top of the tongue of humidity field. Comparing the vertical distribution of humidity near the center of tornadic extratropical cyclones and the tail of the cold front, the strong cold pool caused by the strong high-level dry intrusion can generate excessively strong downdraft, which may be an unfavorable factor for tornado formation. Extratropical cyclone tornadoes are mostly distributed in the distributary area of the left air flow of the upper-level jet, corresponding to the strong upper-level divergence area. The large value area of 0-3 km vertical temperature lapse rate has a good correspondence with the high incidence area of weak tornadoes near the center of extratropical cyclones. Liaoning is one of the active regions for tornadoes in China, and the generation of a considerable number of tornadoes is associated with extratropical cyclones. In order to improve the understanding of environmental background and physical parameter characteristics, 42 extratropical cyclone tornadoes in Liaoning from 1979 to 2020 are statistically analyzed. The study is based on the reanalysis data of ERA5(ECMWF Reanalysis V5), combining with records of China Meteorological Disaster Classic and China Meteorological Disaster Yearbook. Results show that extratropical cyclone tornadoes are mainly distributed in the central and western Liaohe Plain and along the coast of the Bohai Bay. Significant tornadoes(EF2 and above) account for 28.6% of all extratropical cyclone tornadoes.Extratropical cyclone tornadoes occur mostly in the southwest and southeast quadrants of extratropical cyclones, corresponding to the warm area before the cold front. The high-value area of the storm relative helicity and convective available potential energy(CAPE) appear in the southwest-southeast quadrant of the extratropical cyclones, with a belt-like distribution. Extratropical cyclone tornadoes are mainly distributed within 1° of latitude in the northwest of the large-value area of storm relative helicity and the strong gradient area at the top of the large-value area of CAPE. The strong tornado parameter(STP) center is located near the -2° of longitude distance and -5° of latitude distance from the center of tornadic extratropical cyclones, and the maximum value is above 0.7. The large value area of STP corresponds to the high-incidence area of EF2 and above extratropical cyclone tornadoes. The cold front and dry line in the surface are the key trigger of extratropical cyclone tornadoes, and the induced tornadoes are mainly distributed near the warm ridge of temperature field and the top of the tongue of humidity field. Comparing the vertical distribution of humidity near the center of tornadic extratropical cyclones and the tail of the cold front, the strong cold pool caused by the strong high-level dry intrusion can generate excessively strong downdraft, which may be an unfavorable factor for tornado formation. Extratropical cyclone tornadoes are mostly distributed in the distributary area of the left air flow of the upper-level jet, corresponding to the strong upper-level divergence area. The large value area of 0-3 km vertical temperature lapse rate has a good correspondence with the high incidence area of weak tornadoes near the center of extratropical cyclones.
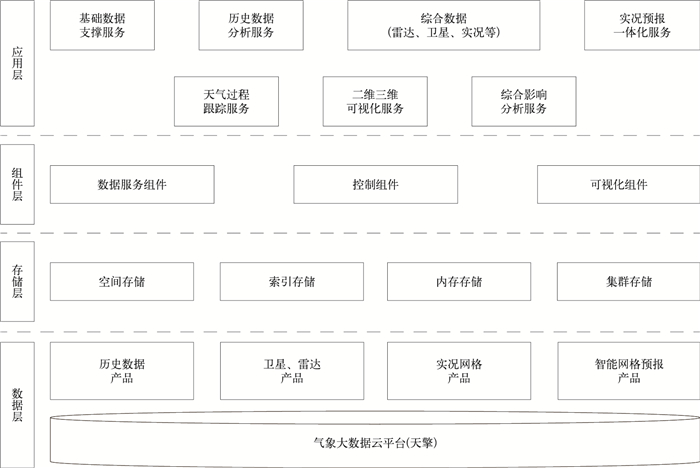
keep_len="250">Meteorological support is demanded during major events, sudden meteorological disasters and flood season consultation services. In traditional way, each department reports and displays the products one by one, which limits operational coordination, interaction and the benefits of real-time support. To improve the service, an integrated command platform for meteorology is built by adopting technologies such as hybrid storage, interface service and layer component release. The platform couples standardized processing of multi-source data, integrated construction of functions, layer rendering and other components loosely. It is based on the meteorological big data cloud platform of China Meteorological Administration, releasing meteorological products such as satellite, radar measurements, real-time and intelligent forecasts. A hybrid integrated application framework is developed for traditional structured data storage, geographic information spatial storage, index storage (Elasticsearch) and page cache storage (Redis), and provides efficient retrieval services. At the same time, the transmission component integrates high and low 8-bit compression and concurrent transmission technology of multiple domain name to improve efficiency. In the aspect of page interaction and visualization, based on NPM (package management tool of JavaScript language), Vue components, WebGL visualization and other front-end technologies, a component-based encapsulation and application service mode is constructed, which gives full play to the high collaboration between cloud computing and edge computing of server and client (browser), supports fast data switching and navigation between different meteorological elements at any geographic location, and provides support for unified access, dispatching and command of multi-source data in various meteorological support services. At present, the platform integrates 113 meteorological products and 1106 layer services, effectively supporting major national meteorological support services such as 2022 Beijing Winter Olympic Games and Winter Paralympic Games. Meteorological support is demanded during major events, sudden meteorological disasters and flood season consultation services. In traditional way, each department reports and displays the products one by one, which limits operational coordination, interaction and the benefits of real-time support. To improve the service, an integrated command platform for meteorology is built by adopting technologies such as hybrid storage, interface service and layer component release. The platform couples standardized processing of multi-source data, integrated construction of functions, layer rendering and other components loosely. It is based on the meteorological big data cloud platform of China Meteorological Administration, releasing meteorological products such as satellite, radar measurements, real-time and intelligent forecasts. A hybrid integrated application framework is developed for traditional structured data storage, geographic information spatial storage, index storage (Elasticsearch) and page cache storage (Redis), and provides efficient retrieval services. At the same time, the transmission component integrates high and low 8-bit compression and concurrent transmission technology of multiple domain name to improve efficiency. In the aspect of page interaction and visualization, based on NPM (package management tool of JavaScript language), Vue components, WebGL visualization and other front-end technologies, a component-based encapsulation and application service mode is constructed, which gives full play to the high collaboration between cloud computing and edge computing of server and client (browser), supports fast data switching and navigation between different meteorological elements at any geographic location, and provides support for unified access, dispatching and command of multi-source data in various meteorological support services. At present, the platform integrates 113 meteorological products and 1106 layer services, effectively supporting major national meteorological support services such as 2022 Beijing Winter Olympic Games and Winter Paralympic Games.


